
Some facts:
Evidences based facts and reference recommendations
© Early risk identification and interventions for individuals at high risk can prevent type 2 diabetes:
© Age is no barrier to being at high risk of, or developing, type 2 diabetes.
© Identifying risk is recommended to be followed by an intensive lifestyle-changing program, physical activity, weight management advice, dietaryadvice and appropriate preventive intervention that can prevent the onset of Type 2 Diabetes.
© Risk assessment and matching interventions to risk can prevent or delay the progression from ‘pre-diabetes’ totype 2 diabetes among individuals at high risk.
How do I asses my risk?
© Blood glucose has been used as a measure of risk assessment. In January 2011 the World Health Organization (WHO) recommended that glycated hemoglobin (HbA1c) could be used as an alternative to standard glucose measures to diagnose.
© Glucose levels fluctuate from minute to minute, hour to hour, and day to day. Thus for hour to hour control, or day to day, a glucose level is the best guide. However the HbA1C level changes slowly, over 10 weeks, so it can be used as a ‘quality control’ test.
© In diabetes glucose tend to rise more than usual, dropping with exercise, rising after food, rising a lot more after sweet food, and can make it hard to control.
© HbA1C is a test to achieve better control (and better health in the long term), Good control produces benefits that lasts 10 years at least.
© In fact HbA1c is now used both for “diagnosis” and “Risk Identification” of the pre diabetes condition
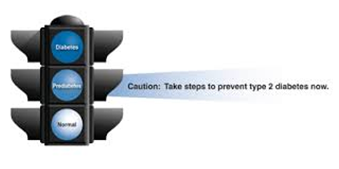
© Diabetes may be defined as having an HbA1c>6.5%. So,
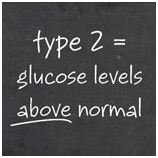
- >6.5% = diabetes
- <6.0% = not diabetic
- in between….6.0-6.5…may be this is ‘pre-diabetes’ or ‘at risk of diabetes’.
What is HbA1c?
© In the blood stream are the red blood cells, which are made of a molecule, haemoglobin. Glucose sticks to the haemoglobin to make a ‘glycosylated haemoglobin’ molecule, called haemoglobin A1C or HbA1C. The more glucose in the blood, the more haemoglobin A1C or HbA1C will be present in the blood.
Illustrated diagrammatically

Haemoglobin in the blood (red, rectangle) combines with glucose in the blood (green, circle) to form glycosylated haemoglobin.
This reaction occurs over a 10 week period.
© Red cells live for 8 -12 weeks before they are replaced. By measuring the HbA1C it can tell you how high your blood glucose has been on average over the last 8-12 weeks. A normal non-diabetic HbA1C is 3.5-5.5%. In diabetes about 6.5% is good.
© The HbA1C test is currently one of the best ways to check diabetes is under control; it is the blood test that gets sent to the laboratory, and it is done on the spot in some places. Remember, the HbA1C is not the same as the glucose level.
© HbA1c levels nearly equate to glucose levels. However HbA1c is a measure of “average glucose levels for past 10 weeks. So an HbA1c level of 7% means the average glucose level for the previous 10 weeks was 8mmol/l.
“Glucose levels fluctuate from minute to minute, hour to hour, and day to day. Thus for hour to hour control, or day to day, a glucose level is the best guide. However the HbA1C level changes slowly, over 10 weeks, so it can be used as a ‘quality control’ screening test. It is an accurate measure of average blood glucose control over past 10 weeks and not altered by immediate dietary change or exercise“.
Identifying the Risk
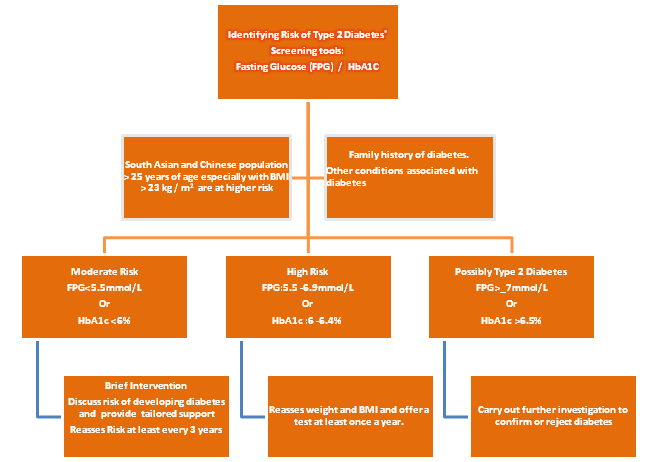
Ref: http://www.nice.org.uk/PH38
References
- New NICE guidelines recommending screening http://www.nice.org.uk/PH38: Preventing type 2 diabetes: risk identification and interventions for individuals at high risk. Issued: July 2012 NICE public health guidance 38 guidance.nice.org.uk/ph38 NHS
- Effect of aging on A1C levels in individuals without diabetes: evidence from the Framingham.Pani LN, Korenda L, Meigs JB, Driver C, Chamany S, Fox CS, Sullivan L, D’Agostino RB, Nathan DM.Diabetes Care. 2008 Oct;31(10):1991-6. Epub 2008
- The impact of the Quality and Outcomes Framework (QOF) on the recording of smoking targets in primary care medical records etc BMC Public Health. 2012 May 4;12(1):329. [Epub]Taggar JS, Coleman T, Lewis S, Szatkowski L.
- Poor care leads to 24 000 premature deaths from diabetes in England each yearState of the Nation, Diabetes UK, 2012BMJ 2011;343:d8081
- Visual acuity in a population with regular screening for type 2 diabetes mellitus and eye diseaseOlafsdottir E, Andersson DK, Stefánsson ECONCLUSIONS:In a population that is carefully screened for diabetes mellitus and provided with regular screening for diabetic retinopathy, the loss of vision from diabetic retinopathy is uncommon.ActaOphthalmol Scand. 2007 Feb;85(1):40-5.
- http://care.diabetesjournals.org/content/early/2012/03/26/dc11-1793
- http://medweb.bham.ac.uk/easdec/prevention/what_is_the_hba1c.htm
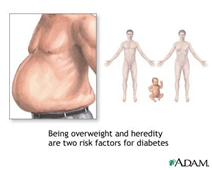
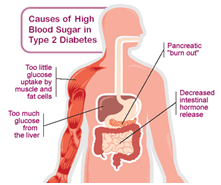
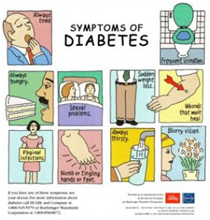
Some pictures about Diabetes